16.7 Visualizing Neural Network Training with TensorBoard
- Difficult to know and fully understand all the details of deep learning networks
- Creates challenges in testing, debugging and updating models and algorithms
- Deep learning learns enormous numbers of features, and they may not be apparent to you
- Google's TensorBoard dashboard tool ([1]) visualizes neural networks implemented in TensorFlow and Keras
- Can give you insights into how well your model is learning and potentially help you tune its hyperparameters
Executing TensorBoard
- Monitors a folder on your system looking for files containing data to visualize
- Change to the
ch16folder - Ensure your custom Anaconda environment
tf_envis activated:conda activate tf_env
- Create a subfolder named
logsin which your deep-learning models will write info to visualize - Execute TensorBoard
tensorboard --logdir=logs - Access TensorBoard in your web browser at
http://localhost:6006
- Change to the
- If you connect to TensorBoard before executing any models, it will initially display a page indicating “No dashboards are active for the current data set.”
The TensorBoard Dashboard
- When TensorBoard sees updates in the
logsfolder, it loads the data into the dashboard:

The TensorBoard Dashboard (cont.)
- Can view the data as you train or after training completes
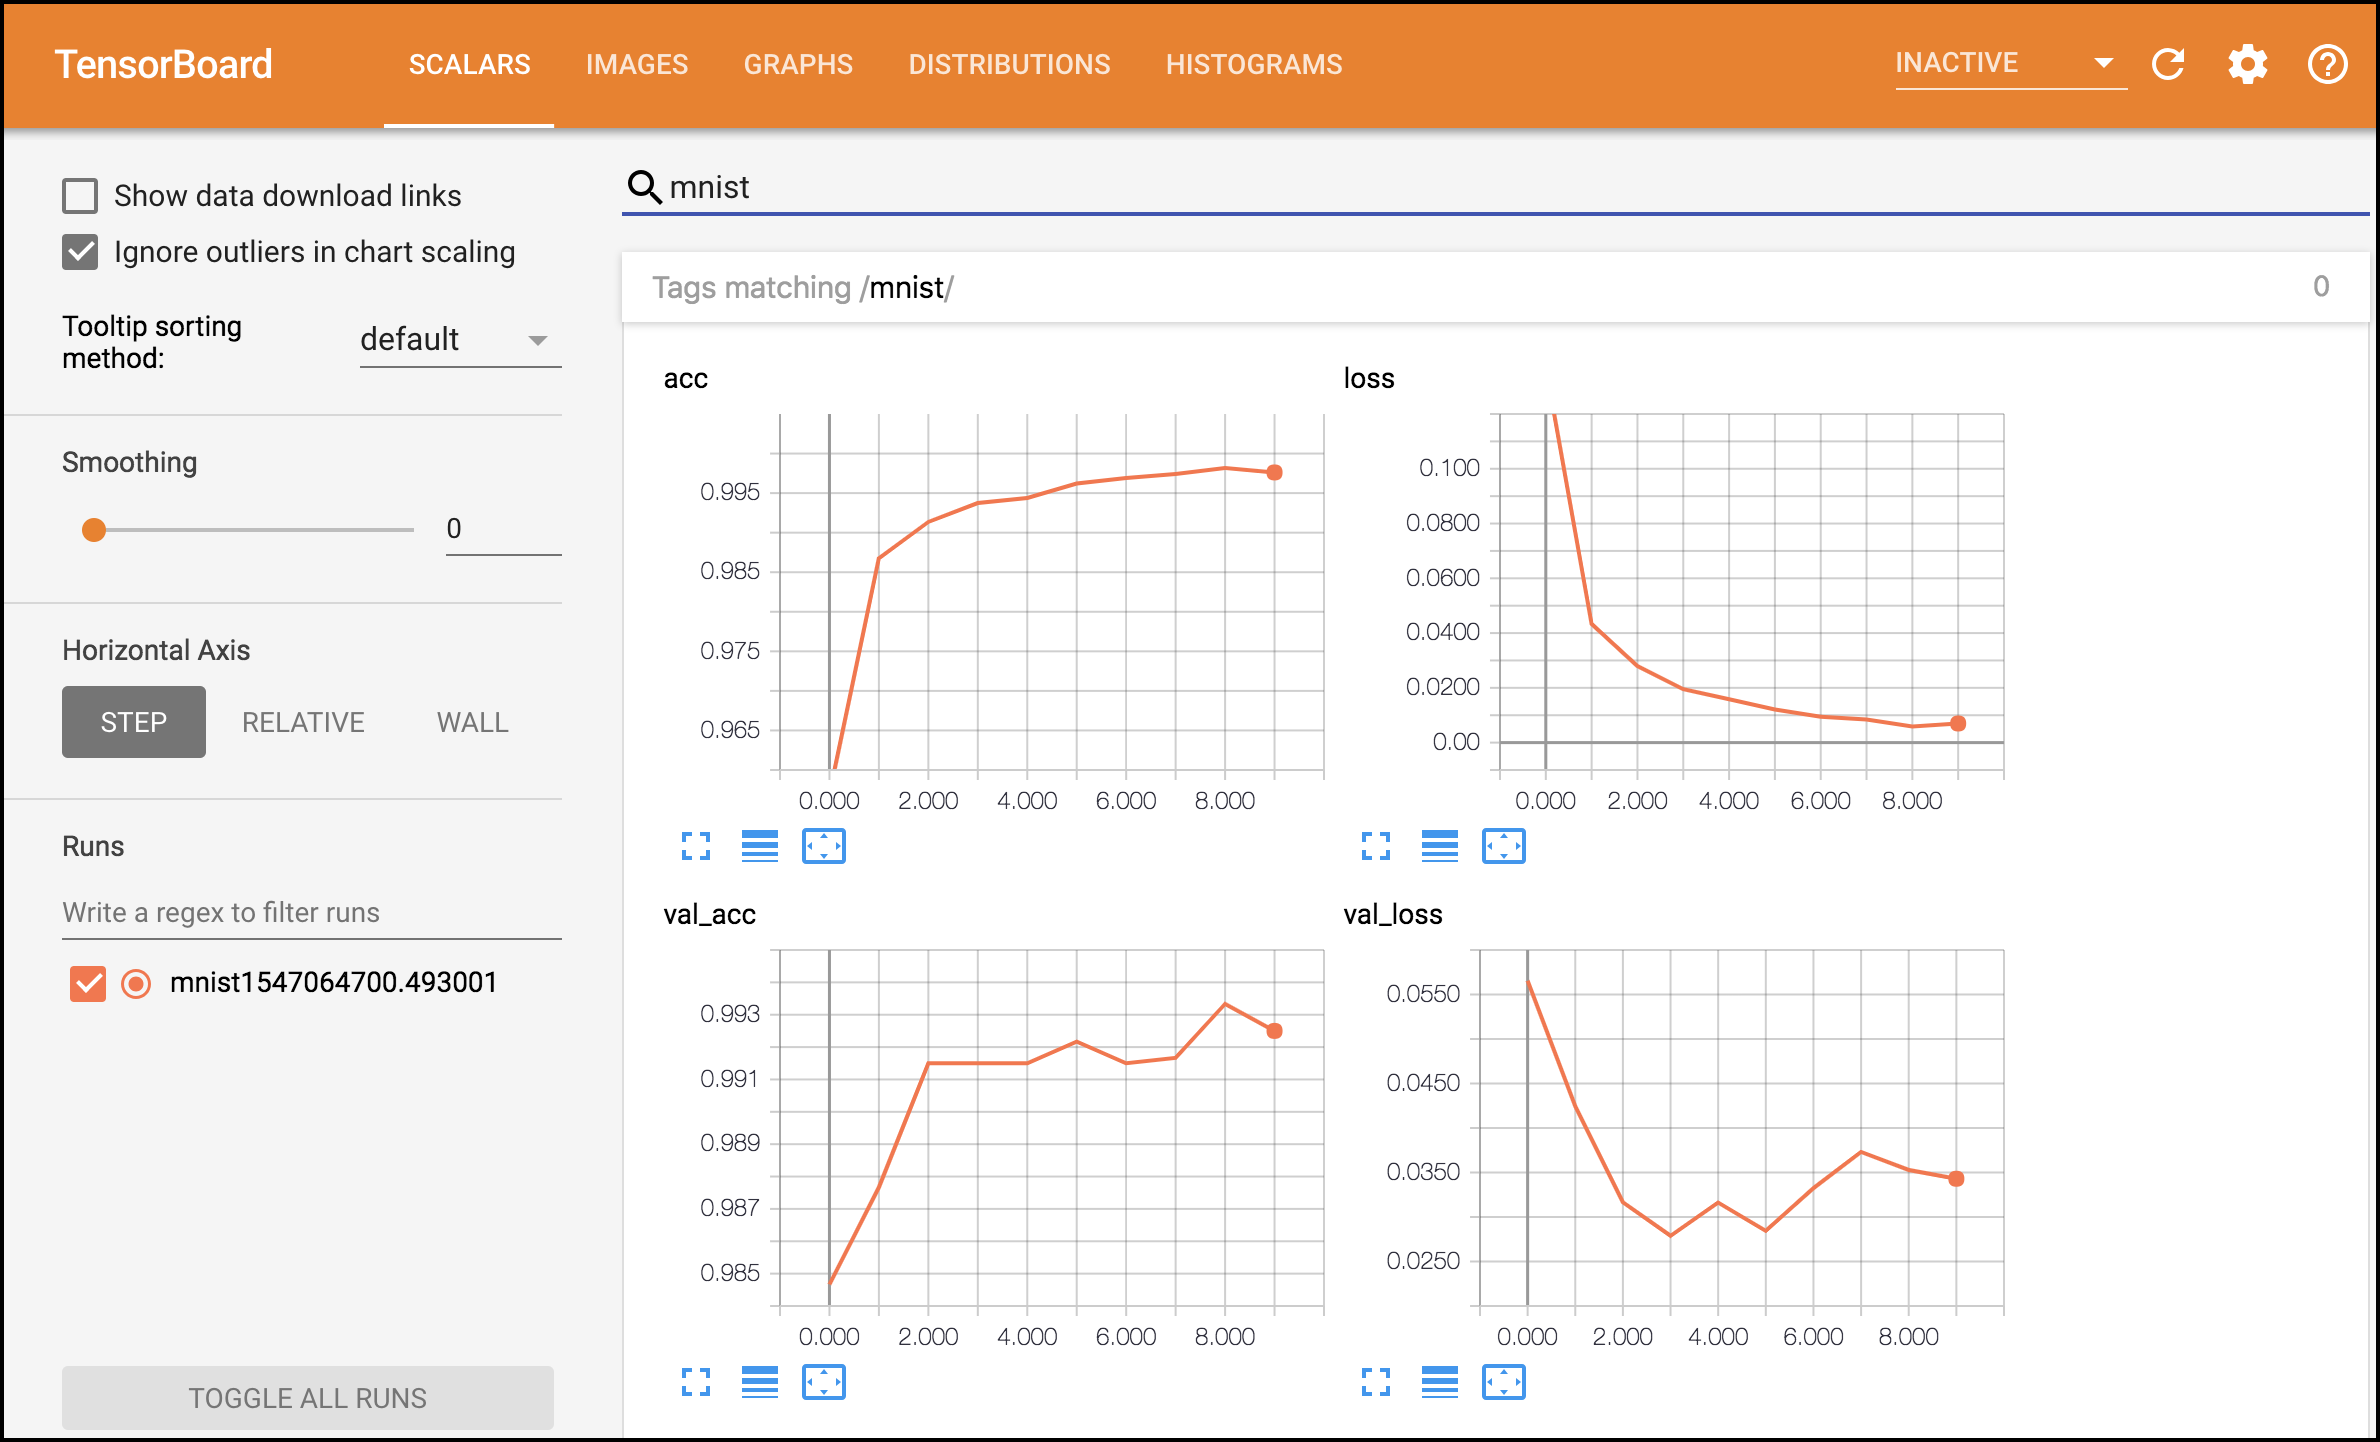
- Dashboard above shows the TensorBoard
SCALARStab- Displays charts for individual values that change over time, such as the training accuracy (
acc), training loss (loss), validation accuracy (val_acc) and validation loss (val_loss)
- Displays charts for individual values that change over time, such as the training accuracy (
- We visualized a 10-epoch run of our MNIST convnet, which we provided in the notebook
MNIST_CNN_TensorBoard.ipynb - Epochs are displayed along the x-axes starting from 0 for the first epoch
- The accuracy and loss values are displayed on the y-axes
The TensorBoard Dashboard (cont.)
- First 5 epochs show similar results to the five-epoch run in the previous section
- For the 10-epoch run, the training accuracy continued to improve through the 9th epoch, then decreased slightly
- Might be the point at which we’re starting to overfit
- Could train longer to find out
- The validation accuracy jumped up quickly, then was relatively flat for five epochs before jumping up then decreasing
- The training loss dropped quickly, then continuously declined through the ninth epoch, before a slight increase
- The validation loss dropped quickly then bounced around
The TensorBoard Dashboard (cont.)
- Normally these diagrams are stacked vertically in the dashboard.
- We used the search field (above the diagrams) to show any that had the name “mnist” in their folder name—we’ll configure that in a moment
- TensorBoard can load data from multiple models at once and you can choose which to visualize
- This makes it easy to compare several different models or multiple runs of the same model
Copy the MNIST Convnet’s Notebook
- To create the new notebook for this example on your own (we already provided a version of it for you):
- Right-click the
MNIST_CNN.ipynbnotebook in JupyterLab’sFile Browsertab and selectDuplicateto make a copy of the notebook - Right-click the new notebook named
MNIST_CNN-Copy1.ipynb, then selectRename, enter the nameMNIST_CNN_TensorBoard.ipynband press Enter
- Right-click the
- Open the notebook by double-clicking its name
Configuring Keras to Write the TensorBoard Log Files
- Before you
fitthe model, you need to configure aTensorBoardobject (moduletensorflow.keras.callbacks), which the model will use to write data into a specified folder that TensorBoard monitors- Known as a callback in Keras
- In the notebook, click to the left of snippet that calls the model’s
fitmethod, then type a to add a new code cell above the current cell (usebfor below) - In the new cell, enter the following code to create the
TensorBoardobject
from tensorflow.keras.callbacks import TensorBoard
import time

tensorboard_callback = TensorBoard(log_dir=f'./logs/mnist{time.time()}',
    histogram_freq=1, write_graph=True)
- Arguments:
log_dir—folder in which this model’s log files will be written. Creating a name based on the time ensures that each new execution of the notebook will have its own log folder- Enables you to compare multiple executions in TensorBoard
histogram_freq—The frequency in epochs that Keras will output to the model’s log files (every epoch in this case)write_graph=True—Output a graph of the model, which you can view in TensorBoard's GRAPHS tab
Updating Our Call to fit
- Modify the original
fitmethod call - For this example, we set the number of epochs to 10 and added the
callbacksargument, which is a list of callback objects:
cnn.fit(X_train, y_train, epochs=10, batch_size=64,
        validation_split=0.1, callbacks=[tensorboard_callback])
- Re-execute the notebook by selecting Kernel > Restart Kernel and Run All Cells in JupyterLab
- After the first epoch completes, you’ll start to see data in TensorBoard
©1992–2020 by Pearson Education, Inc. All Rights Reserved. This content is based on Chapter 5 of the book Intro to Python for Computer Science and Data Science: Learning to Program with AI, Big Data and the Cloud.
DISCLAIMER: The authors and publisher of this book have used their best efforts in preparing the book. These efforts include the development, research, and testing of the theories and programs to determine their effectiveness. The authors and publisher make no warranty of any kind, expressed or implied, with regard to these programs or to the documentation contained in these books. The authors and publisher shall not be liable in any event for incidental or consequential damages in connection with, or arising out of, the furnishing, performance, or use of these programs.