17.8 Internet of Things and Dashboards
- Internet has grown to billions of connected computers, smartphones, tablets and an enormous range of other device types
- Any device connected to the Internet is a “thing” in the Internet of Things (IoT)
- Each device has a unique Internet protocol address (IP address) that identifies it
- “Top research firms such as Gartner and McKinsey predict a jump from the 6 billion connected devices we have worldwide today, to 20–30 billion by 2020”
- Various predictions say that number could be 50 billion
17.8 Internet of Things and Dashboards
| Small subset of IoT device types and applications |
|---|
| activity trackers—Apple Watch, FitBit, … |
| personal assistants—Amazon Echo (Alexa), Apple HomePod (Siri), Google Home (Google Assistant) |
| appliances—ovens, coffee makers, refrigerators, … |
| driverless cars |
| earthquake sensors |
| healthcare—blood glucose monitors for diabetics, blood pressure monitors, electrocardiograms (EKG/ECG), electroencephalograms (EEG), heart monitors, ingestible sensors, pacemakers, sleep trackers, … |
| sensors—chemical, gas, GPS, humidity, light, motion, pressure, temperature, … |
| smart home—lights, garage openers, video cameras, doorbells, irrigation controllers, security devices, smart locks, smart plugs, smoke detectors, thermostats, air vents |
| tracking devices |
| wireless network devices |
17.8.1 Publish and Subscribe
- IoT devices (and more) commonly communicate via pub/sub (publisher/subscriber) systems
- Publisher — Anything that sends a message to a cloud-based service, which in turn sends that message to all subscribers
- Publisher specifies a topic or channel
- Subscriber specifies one or more topics or channels for which they’d like to receive messages
17.8.2 Visualizing a PubNub Sample Live Stream with a Freeboard Dashboard
- PubNub is geared to real-time pub/sub applications
- Many use-cases
- IoT, chat, online multiplayer games, social apps, collaborative apps
- Provides several demo live streams, including one that simulates IoT sensors
- Common to visualize live data streams for monitoring purposes
- Here is a Freeboard.io web-based dashboard that — without writing code — connects to a live data stream and visualizes the data
- For each sensor, we used a Gauge and a Sparkline
- Sparkline — Line graph without axes that shows data value changing over time
- Lecture Note: Show some of the settings
Signing up for Freeboard.io
- Register for a Freeboard.io 30-day trial
- Once registered, the My Freeboards page appears
- If you’d like, you can click the Try a Tutorial button and visualize data from your smartphone
Creating a New Dashboard
- In the upper-right corner of the My Freeboards page, enter
Sensor Dashboardin the enter a name field, then click the Create New button to create a dashboard. - This displays the dashboard designer.
Adding a Data Source
- If you add your data source(s) before designing your dashboard, you’ll be able to configure each visualization as you add it:
- Under DATASOURCES, click ADD to specify a new data source.
- The DATASOURCE dialog’s TYPE drop-down list shows the currently supported data sources, though you can develop plug-ins for new data sources as well
- Select PubNub
- The web page for each PubNub sample live stream specifies the Channel and Subscribe key
- Copy these values from PubNub’s Sensor Network page at https://www.pubnub.com/developers/realtime-data-streams/sensor-network/, then insert their values in the corresponding DATASOURCE dialog fields
- Provide a NAME for your data source, then click SAVE
Adding a Pane for the Humidity Sensor
- A Freeboard.io dashboard is divided into panes that group visualizations.
- Multiple panes can be dragged to rearrange them.
- Click the + Add Pane button to add a new pane.
- Each pane can have a title.
- To set it, click the wrench icon on the pane, specify
Humidityfor the TITLE, then click SAVE.
Adding a Gauge to the Humidity Pane
- To add visualizations to a pane, click its + button to display the WIDGET dialog.
- The TYPE drop-down list shows several built-in widgets.
- Choose Gauge.
- To the right of the VALUE field, click + DATASOURCE, then select the name of your data source.
- This displays the available values from that data source.
- Click humidity to select the humidity sensor’s value.
- For UNITS, specify
%, then click SAVE. - This displays the new visualization, which immediately begins showing values from the sensor stream.
- Notice that the humidity value has four digits of precision to the right of the decimal point.
Adding a Gauge to the Humidity Pane (cont.)
- PubNub supports JavaScript expressions, so you can use them to perform calculations or format data.
- For example, you can use JavaScript’s function
Math.roundto round the humidity value to the closest integer. - To do so, hover the mouse over the gauge and click its wrench icon.
- Then, insert
"Math.round("before the text in the VALUE field and")"after the text, then clickSAVE.
Adding a Sparkline to the Humidity Pane
- A sparkline is a line graph without axes that’s typically used to give you a sense of how a data value is changing over time.
- Add a sparkline for the humidity sensor by clicking the humidity pane’s
+button, then selecting Sparkline from the TYPE drop-down list. - For the VALUE, once again select your data source and humidity, then click SAVE.
Completing the Dashboard
- Using the techniques above, add two more panes and drag them to the right of the first.
- Name them Radiation Level and Ambient Temperature, respectively, and configure each pane with a Gauge and Sparkline as shown above.
- For the Radiation Level gauge, specify
Millirads/Hourfor the UNITS and400for the MAXIMUM. - For the Ambient Temperature gauge, specify
Celsiusfor the UNITS and50for the MAXIMUM.
17.8.3 Simulating an Internet-Connected Thermostat in Python
- Common to use IoT simulators for testing, especially if you do not have access to actual devices and sensors during development
- Many cloud vendors have IoT simulation capabilities
- IBM Watson IoT Platform, IOTIFY.io, ...
- We'll create a script that simulates IoT thermostat
- Uses
dweet.ioto publish periodic JSON messages—called dweets (like a tweet from a device)
- Uses
17.8.3 Simulating an Internet-Connected Thermostat in Python (cont.)
- We'll simulate a temperature sensor that can issue
- low-temperature warnings before pipes freeze
- high-temperature warnings to indicate there might be a fire
- Our dweets will contain
- location
- temperature
- low or high temperature warnings if the temperature drops to 3 degrees Celsius or rises to 35 degrees Celsius
- Use
freeboard.ioto create a dashboard
Installing Dweepy
pip install dweepy- Dweepy documentation
Invoking the simulator.py Script
- Script
simulator.pysimulates our thermostat - Invoke script with two command-line arguments
ipython simulator.py 1000 1
- number of total messages to simulate
- delay in seconds between sending dweets
- Can immediately begin tracking messages on the
dweet.iosite at
Sending Dweets
dweet.iois a public service, so any app can publish or subscribe to messages- Do not need to register to use the service
- When publishing, specify a unique name for your device
- We used
'temperature-simulator-deitel-python'
- We used
- On first call to
dweepy’sdweet_forfunction to send a dweet,dweet.iocreates the device name- Function receives device name and a dictionary representing the message to send
- Sends dictionary in JSON format
Script That Sends Dweets
# simulator.py
"""A connected thermostat simulator that publishes JSON
messages to dweet.io"""
import dweepy
import sys
import time
import random

MIN_CELSIUS_TEMP = -25
MAX_CELSIUS_TEMP = 45
MAX_TEMP_CHANGE = 2

# get the number of messages to simulate and delay between them
NUMBER_OF_MESSAGES = int(sys.argv[1])
MESSAGE_DELAY = int(sys.argv[2])

dweeter = 'temperature-simulator-deitel-python'  # provide a unique name
thermostat = {'Location': 'Boston, MA, USA',
              'Temperature': 20,
              'LowTempWarning': False,
              'HighTempWarning': False}
print('Temperature simulator starting')

for message in range(NUMBER_OF_MESSAGES):
    # generate a random number in the range -MAX_TEMP_CHANGE
    # through MAX_TEMP_CHANGE and add it to the current temperature
    thermostat['Temperature'] += random.randrange(
        -MAX_TEMP_CHANGE, MAX_TEMP_CHANGE + 1)

    # ensure that the temperature stays within range
    if thermostat['Temperature'] < MIN_CELSIUS_TEMP:
        thermostat['Temperature'] = MIN_CELSIUS_TEMP

    if thermostat['Temperature'] > MAX_CELSIUS_TEMP:
        thermostat['Temperature'] = MAX_CELSIUS_TEMP

    # check for low temperature warning
    if thermostat['Temperature'] < 3:
        thermostat['LowTempWarning'] = True
    else:
        thermostat['LowTempWarning'] = False

    # check for high temperature warning
    if thermostat['Temperature'] > 35:
        thermostat['HighTempWarning'] = True
    else:
        thermostat['HighTempWarning'] = False

    # send the dweet to dweet.io via dweepy
    print(f'Messages sent: {message + 1}\r', end='')
    dweepy.dweet_for(dweeter, thermostat)
    time.sleep(MESSAGE_DELAY)

print('Temperature simulator finished')
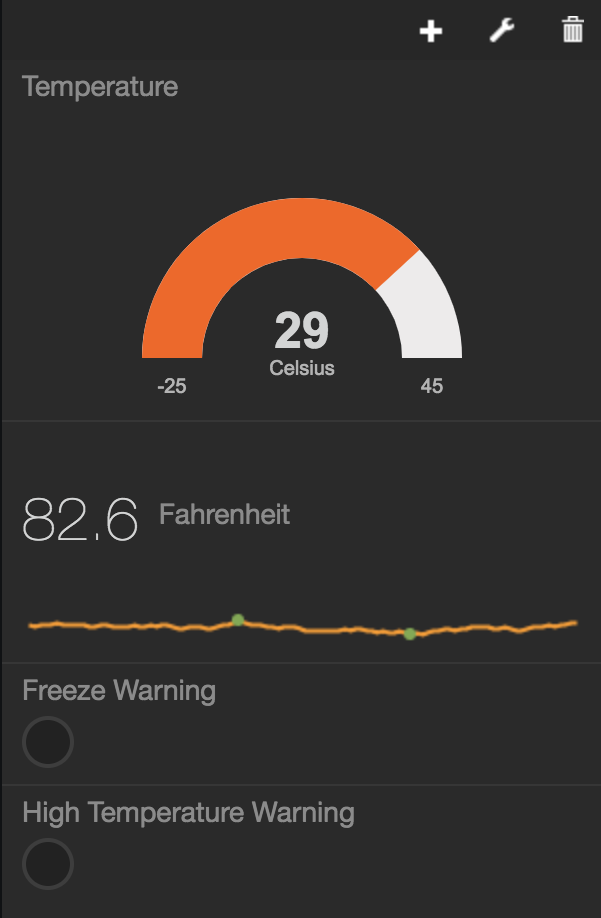
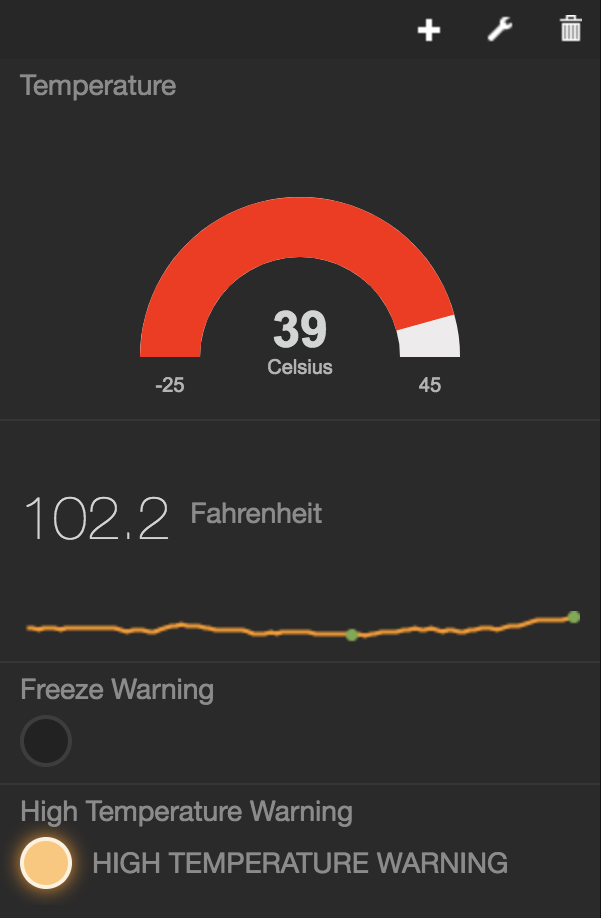
17.8.4 Creating the Dashboard with Freeboard.io
Dashboard contains:
- A Gauge widget showing the current temperature
- A Text widget to show the current temperature in Fahrenheit
- Two Indicator Light widgets for low and high temperature warnings

16.8.5 Creating a Python PubNub Subscriber
pubnubmodule for performing pub/sub operations- Seven sample streams for you to experiment with—four real-time streams and three simulated streams
- Twitter Stream—Up to 50 tweets-per-second from live Twitter stream
- Hacker News Articles—Streams this site’s recent articles
- State Capital Weather—Streams weather data for the U.S. state capitals
- Wikipedia Changes—Stream of Wikipedia edits
- Game State Sync—Simulated multiplayer game data
- Sensor Network—Simulated sensor data: radiation, humidity, temperature and ambient light
- Market Orders—Simulated stock orders for five fake companies
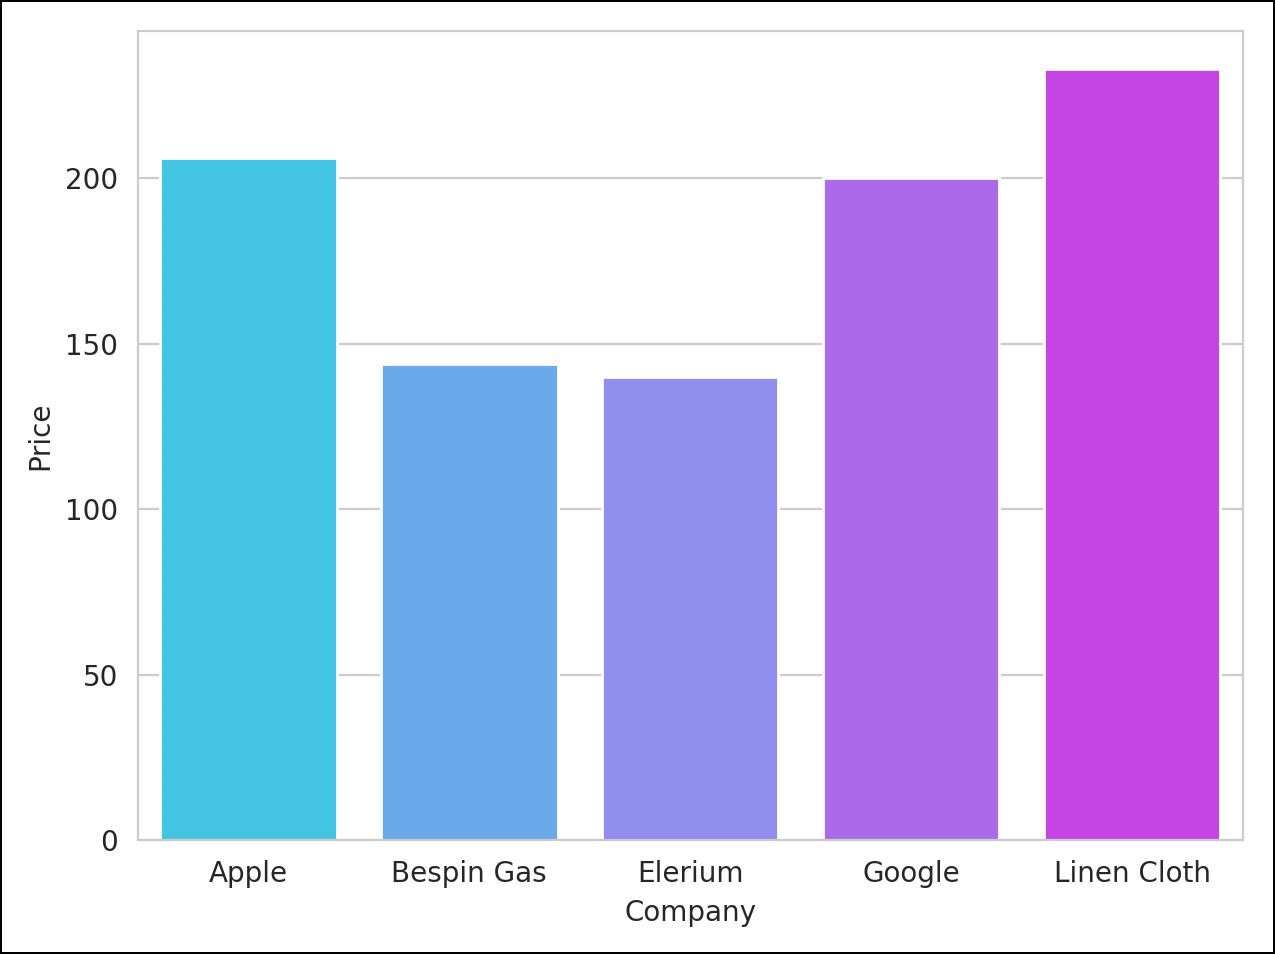
17.8.5 Creating a Python PubNub Subscriber (cont.)
- We'll subscribe to their Market Orders stream, then visualize changing stock prices in a barplot
- Also can publish messages to streams
pip install "pubnub>=4.1.2"stocklistener.pysubscribes to the stream and visualizes the stock prices
Message Format
- Simulated Market Orders stream returns JSON objects containing five key–value pairs with the keys
'bid_price','order_quantity','symbol','timestamp'and'trade_type'- We’ll use
'bid_price'and'symbol'
- We’ll use
- PubNub client returns JSON objects as Python dictionaries
Importing the Libraries
# stocklistener.py
"""Visualizing a PubNub live stream."""
from matplotlib import animation
import matplotlib.pyplot as plt
import pandas as pd
import random
import seaborn as sns
import sys

from pubnub.callbacks import SubscribeCallback
from pubnub.enums import PNStatusCategory
from pubnub.pnconfiguration import PNConfiguration
from pubnub.pubnub import PubNub
Initialize List and DataFrame Used for Storing Company Names and Prices
- Pandas
DataFramecompanies_dfstores each company’s last price
companies = ['Apple', 'Bespin Gas', 'Elerium', 'Google', 'Linen Cloth']

# DataFrame to store last stock prices
companies_df = pd.DataFrame(
    {'company': companies, 'price' : [0, 0, 0, 0, 0]})
Class SensorSubscriberCallback
- A PubNub stream listener receives status notifications and messages from the channel
- Subclass of
SubscribeCallback(modulepubnub.callbacks) - Overridden method
status— called by PubNub client each time a status notification arrives- We check for subscribed to or unsubscribed from a channel messages
- Overridden method
message— called when a message arrives from the channel- Stores new stock price
class SensorSubscriberCallback(SubscribeCallback):
    """SensorSubscriberCallback receives messages from PubNub."""
    def __init__(self, df, limit=1000):
        """Create instance variables for tracking number of tweets."""
        self.df = df  # DataFrame to store last stock prices
        self.order_count = 0
        self.MAX_ORDERS = limit  # 1000 by default
        super().__init__()  # call superclass's init
def status(self, pubnub, status):
        if status.category == PNStatusCategory.PNConnectedCategory:
            print('Connected to PubNub')
        elif status.category == PNStatusCategory.PNAcknowledgmentCategory:
            print('Disconnected from PubNub')
def message(self, pubnub, message):
        symbol = message.message['symbol']
        bid_price = message.message['bid_price']
        print(symbol, bid_price)
        self.df.at[companies.index(symbol), 'price'] = bid_price
        self.order_count += 1

        # if MAX_ORDERS is reached, unsubscribe from PubNub channel
        if self.order_count == self.MAX_ORDERS:
            pubnub.unsubscribe_all()
Function update Visualizes the Stock Prices
def update(frame_number):
    """Configures bar plot contents for each animation frame."""
    plt.cla()  # clear old barplot
    axes = sns.barplot(
        data=companies_df, x='company', y='price', palette='cool')
    axes.set(xlabel='Company', ylabel='Price')
    plt.tight_layout()
Configuring the Application
if __name__ == '__main__':
    sns.set_style('whitegrid')  # white background with gray grid lines
    figure = plt.figure('Stock Prices')  # Figure for animation
Configuring the FuncAnimation and Displaying the Window
- Matplotlib’s
showmethod normally blocks a script from continuing until you close theFigureblock=Falseallows execution to continue- we'll configure Pubnub client next
- For detailed intro to Matplotlib
FuncAnimation, see my Python Fundamentals LiveLessons videos (two videos) and in Python for Programmers, Section 6.4
# configure and start animation that calls function update
    stock_animation = animation.FuncAnimation(
        figure, update, repeat=False, interval=33)
    plt.show(block=False)  # display window
Configuring the PubNub Client
- Specify the PubNub subscription key
- Used with the channel name to subscribe to the channel
- The
SensorSubscriberCallbackobject is passed to thePubNubclient’sadd_listenermethod to register it to receive messages from the channel
# set up pubnub-market-orders sensor stream key
    config = PNConfiguration()
    config.subscribe_key = 'sub-c-4377ab04-f100-11e3-bffd-02ee2ddab7fe'

    # create PubNub client and register a SubscribeCallback
    pubnub = PubNub(config)
    pubnub.add_listener(
        SensorSubscriberCallback(df=companies_df,
            limit=int(sys.argv[1] if len(sys.argv) > 1 else 1000))
Subscribing to the Channel
- Completes subscription process by indicating that we wish to receive messages from channel
'pubnub-market-orders' execute()tells client to begin listening for messages
# subscribe to pubnub-sensor-network channel and begin streaming
    pubnub.subscribe().channels('pubnub-market-orders').execute()
Ensuring the Figure Remains on the Screen
plt.show() # keeps graph on screen until you dismiss its window
©1992–2020 by Pearson Education, Inc. All Rights Reserved. This content is based on Chapter 5 of the book Intro to Python for Computer Science and Data Science: Learning to Program with AI, Big Data and the Cloud.
DISCLAIMER: The authors and publisher of this book have used their best efforts in preparing the book. These efforts include the development, research, and testing of the theories and programs to determine their effectiveness. The authors and publisher make no warranty of any kind, expressed or implied, with regard to these programs or to the documentation contained in these books. The authors and publisher shall not be liable in any event for incidental or consequential damages in connection with, or arising out of, the furnishing, performance, or use of these programs.